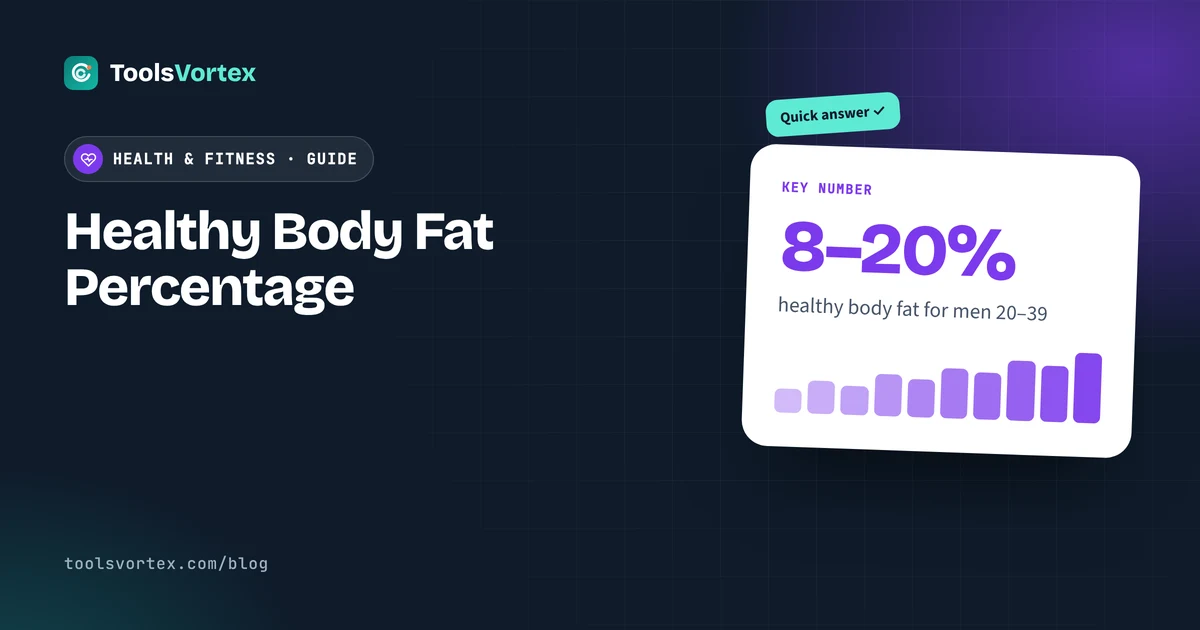
A healthy body fat percentage for adults aged 20 to 39 is about 21 to 33% for women and 8 to 20% for men. The healthy range creeps up a couple of points with each age band, reaching about 24 to 36% for women and 13 to 25% for men aged 60 to 79 (ranges based on Gallagher et al., 2000).

Your bathroom scale says 172. Fine. But 172 of what? Two people at the same weight can have totally different amounts of fat, and that difference matters more for your health than the weight itself. So let's look at what a healthy body fat percentage actually is, where the numbers come from, and how to measure yours without paying for a lab.
What Is a Healthy Body Fat Percentage for Women by Age?
For women, the healthy body fat range is 21 to 33 percent at ages 20 to 39, 23 to 35 percent at 40 to 59, and 24 to 36 percent at 60 to 79. The age-based charts you see on gym walls mostly trace back to one study. In 2000, Dympna Gallagher and colleagues measured body fat in adults in New York, the UK and Japan, then matched it to BMI cutoffs. A BMI of 18.5 lined up with the bottom of the healthy range, 25 with "overweight," 30 with "obese." The ranges below are the commonly published version of their numbers.
| Age | Underfat | Healthy | Overweight | Obese |
|---|---|---|---|---|
| 20 to 39 | under 21% | 21 to 33% | 33 to 39% | over 39% |
| 40 to 59 | under 23% | 23 to 35% | 35 to 40% | over 40% |
| 60 to 79 | under 24% | 24 to 36% | 36 to 42% | over 42% |
What Is a Healthy Body Fat Percentage for Men by Age?
| Age | Underfat | Healthy | Overweight | Obese |
|---|---|---|---|---|
| 20 to 39 | under 8% | 8 to 20% | 20 to 25% | over 25% |
| 40 to 59 | under 11% | 11 to 22% | 22 to 28% | over 28% |
| 60 to 79 | under 13% | 13 to 25% | 25 to 30% | over 30% |
For men, the healthy body fat range is 8 to 20 percent at ages 20 to 39, 11 to 22 percent at 40 to 59, and 13 to 25 percent at 60 to 79. Ranges adapted from Gallagher D. et al., American Journal of Clinical Nutrition, 2000. You'll see versions online that differ by a point here or there, because charts round the published figures differently. The study's numbers are for white adults; it found Asian adults tended to carry more fat at the same BMI.
Fitness categories (the gym chart)
There's a second chart floating around, from the American Council on Exercise. It doesn't care about age. It sorts people by how lean they are, which is more useful if you train.
| Category | Women | Men |
|---|---|---|
| Bare minimum (needed to live) | 10 to 13% | 2 to 5% |
| Athletes | 14 to 20% | 6 to 13% |
| Fit | 21 to 24% | 14 to 17% |
| Typical | 25 to 31% | 18 to 24% |
| Obesity range | 32% and up | 25% and up |
Don't chase the athlete row unless you compete. Lots of perfectly healthy people live in the "typical" row their whole lives.
Why the ranges differ by sex and age
Women need more fat. Some of it sits in the breasts and hips and supports hormones and pregnancy, so the floor is just higher. A woman at 22% and a man at 12% can be equally fit.
Age matters because muscle slowly shrinks after about 30 unless you work to keep it, and fat tends to fill in. A bit more fat in your 60s isn't a failure. Where it sits matters more: fat around the belly (visceral fat, packed around the organs) is the type linked to diabetes and heart disease. That's why your waist measurement is worth knowing even if you never get a body fat number. A handy check: keep your waist under half your height. At 5'6" (66 inches), that's under 33 inches.
Which Body Fat Measurement Method Is Most Accurate?
A DEXA scan gives the most accurate single reading, with an error of about 1 to 2 points, while calipers, smart scales and the tape measure are off by about 3 to 5 points. Every method estimates. Even the expensive ones. Here's how they stack up, with rough error ranges compared with lab reference methods:
| Method | Rough error | Cost | Good for |
|---|---|---|---|
| DEXA scan | about ±1 to 2 points | $50 to 150 a scan | Best single reading, also shows where fat sits |
| Underwater weighing | about ±2 points | $40 to 100, hard to find | Old gold standard |
| Bod Pod (air displacement) | about ±2 to 3 points | $40 to 75 | Quick, no dunking |
| Skinfold calipers | ±3 to 4 points (skilled tester) | $10 calipers | Cheap, but tester matters a lot |
| Smart scale / handheld BIA | ±3 to 5 points, swings daily | $25 to 100 | Trends, if used at the same time each day |
| Tape measure (Navy method) | about ±3 to 4 points | A $3 tape | Free, repeatable, decent trend line |
Error ranges are approximate and vary between studies and equipment. Prices are typical U.S. ranges and vary by city.
My honest take? Pick one method and stick with it. A smart scale that reads 3 points high every single morning still shows you whether you're going the right way. Switching between methods is how people convince themselves they gained 4% fat over a weekend.
The tape-measure (U.S. Navy) method, worked out
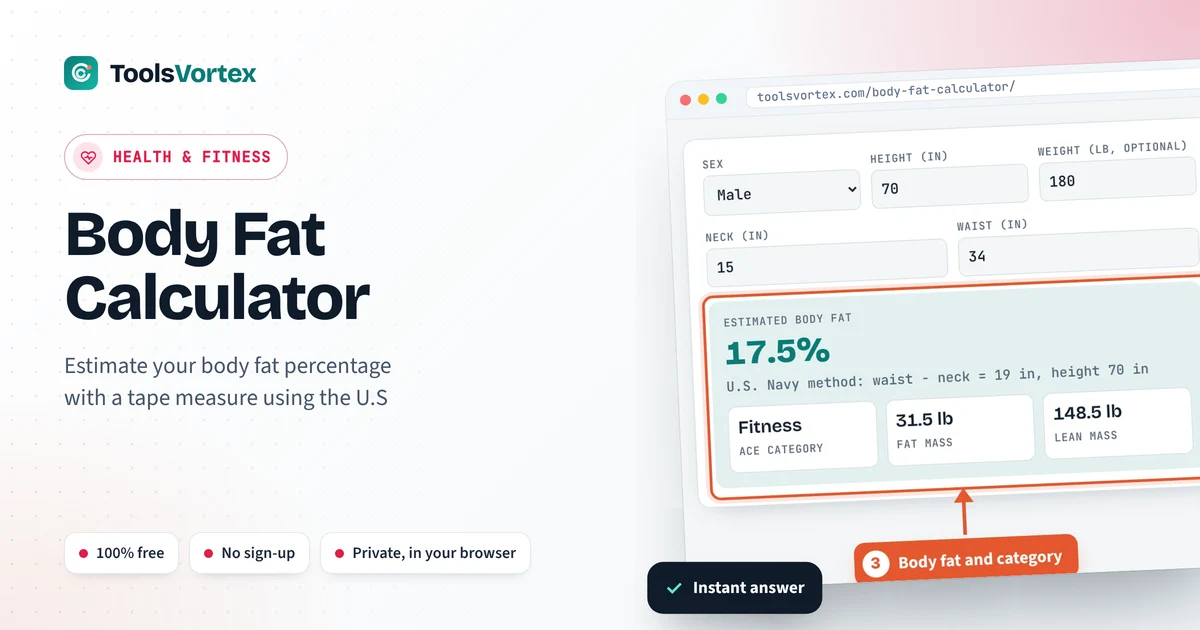
The Navy formula only needs height, neck and waist (and hips for women). Grab a soft tape. Measure the neck just under the Adam's apple, the waist at the navel for men or the narrowest point for women, and the hips at the widest point. Keep the tape snug, not squeezing. Measure everything in inches.
Women: %BF = 163.205 × log10(waist + hip − neck) − 97.684 × log10(height) − 78.387
Marcus is 34, 5'10" (70 in), neck 15.5 in, waist 37 in.
- Waist − neck = 21.5. log10(21.5) = 1.3324, times 86.010 = 114.60
- log10(70) = 1.8451, times 70.041 = 129.23
- 114.60 − 129.23 + 36.76 = 22.1%
For a man in his 30s that's just over the healthy line. Two inches off his waist would bring him to about 18%.
Here's how much the waist alone moves the result. Men: 5'10", 15.5-inch neck. Women: 5'5", 13-inch neck, 40-inch hips (her waist is 4 inches less than the row label).
| Man's waist | Man | Woman (waist − 4 in) |
|---|---|---|
| 32 in | 12.2% | 28.6% |
| 34 in | 16.5% | 31.1% |
| 36 in | 20.4% | 33.5% |
| 38 in | 23.8% | 35.9% |
| 40 in | 27.0% | 38.2% |
| 42 in | 29.9% | 40.4% |
Tracking it without obsessing
Measure once every two to four weeks, first thing in the morning, before eating. Same tape, same spot. And keep your expectations sane: losing one percentage point of body fat a month is good progress.
If you're trying to bring the number down, the work is mostly food plus strength training. Start with our guide to how many calories to eat to lose weight, then set a protein goal with the protein intake calculator. Lifting keeps the muscle you have, which is half the battle. Our BMI calculator is a fine quick check alongside it, as long as you remember its blind spot with muscular people.
Healthy body fat percentage: quick recap
- What is a healthy body fat percentage for men? Roughly 8% to 20% in your 20s and 30s, a few points higher with age.
- What is a healthy body fat percentage for women? Roughly 21% to 33% in your 20s and 30s, rising a little after 40.
- Is a very low healthy body fat percentage better? No, going under essential fat levels can hurt hormones and health.
- How do I check my healthy body fat percentage at home? A tape measure and the Navy method get you within a few points.
- Track the trend of your healthy body fat percentage monthly rather than chasing one perfect reading.
Frequently asked questions
What is a healthy body fat percentage for a woman?
For women aged 20 to 39, roughly 21% to 33% is the healthy range in the widely used Gallagher reference chart. It drifts up with age: about 23 to 35% in your 40s and 50s, and 24 to 36% from 60 to 79.
What is a healthy body fat percentage for a man?
About 8% to 20% for men aged 20 to 39, 11 to 22% for ages 40 to 59, and 13 to 25% for 60 to 79, using the same reference chart.
Why do women have more body fat than men?
Women carry more fat that the body actually needs for hormones and reproduction. Even very lean female athletes rarely go much below the low teens, while men can sit in single digits.
Is 25% body fat good?
Depends who you are. For a 30-year-old woman it's right in the healthy range. For a 30-year-old man it's at the line between overweight and obese on the age chart.
How accurate are body fat scales?
Rough, mostly. Home scales send a tiny current through your feet, and how much water you're holding can swing the reading by several points. Use them for trends measured at the same time of day, not for a single number.
Can body fat be too low?
Yes. Below about 10 to 13% for women or 2 to 5% for men, you're into the fat your body needs to function. Missed periods, low energy, weaker bones and frequent illness are warning signs.
Is BMI or body fat percentage better?
Body fat percentage tells you more, because BMI can't tell muscle from fat. But BMI takes five seconds and body fat needs a decent measurement. Using both, plus your waist size, gives the clearest picture.
Sources
- Healthy percentage body fat ranges: an approach for developing guidelines based on body mass index, Gallagher D. et al., American Journal of Clinical Nutrition, 2000 (source of the age charts)
- Percent Body Fat Calculator, American Council on Exercise (fitness categories)
- Adult BMI Calculator, Centers for Disease Control and Prevention