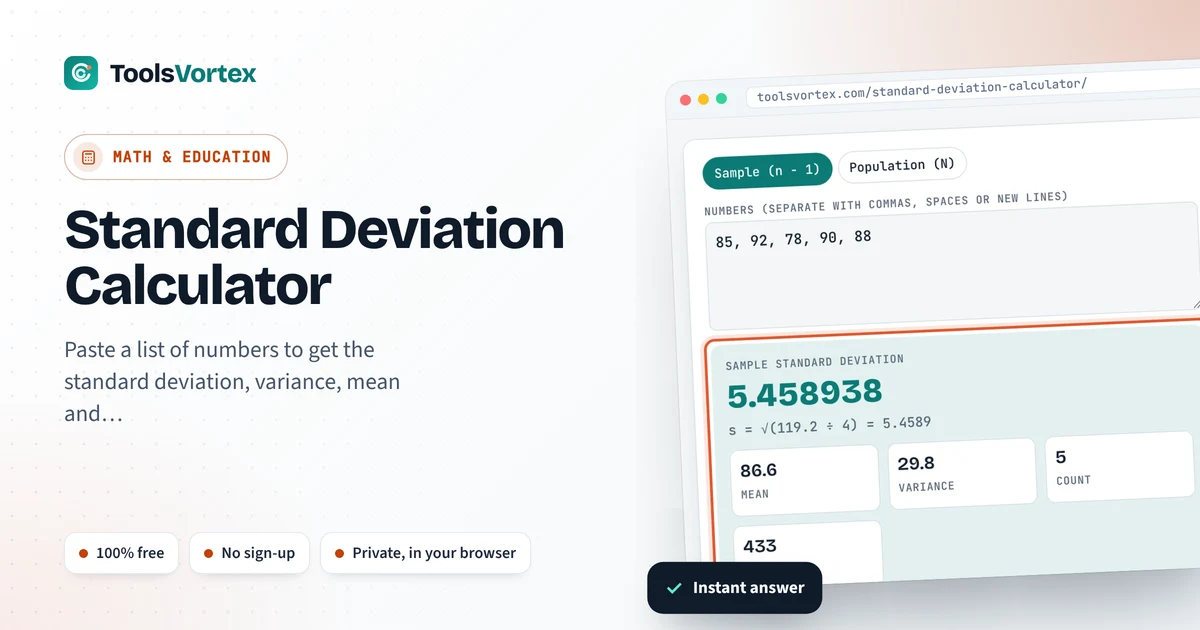
Paste your numbers and get the standard deviation, variance, mean and count, for a sample or a whole population, with each step written out.

A standard deviation calculator answers one nosy little question: how spread out are these numbers, really? Small answer, and everything’s huddled near the average like kids around a campfire. Big answer, and your values are scattered all over the yard. Teachers run it on test scores. Quality folks run it on bolt lengths. And pretty much every intro stats class assigns it at least once, usually on a Friday. Paste your list, pick sample or population, and you’ll get the number with every line of working. That last part’s what saves you when your homework’s off by 0.4 and you’ve no clue why.
How do I calculate standard deviation?
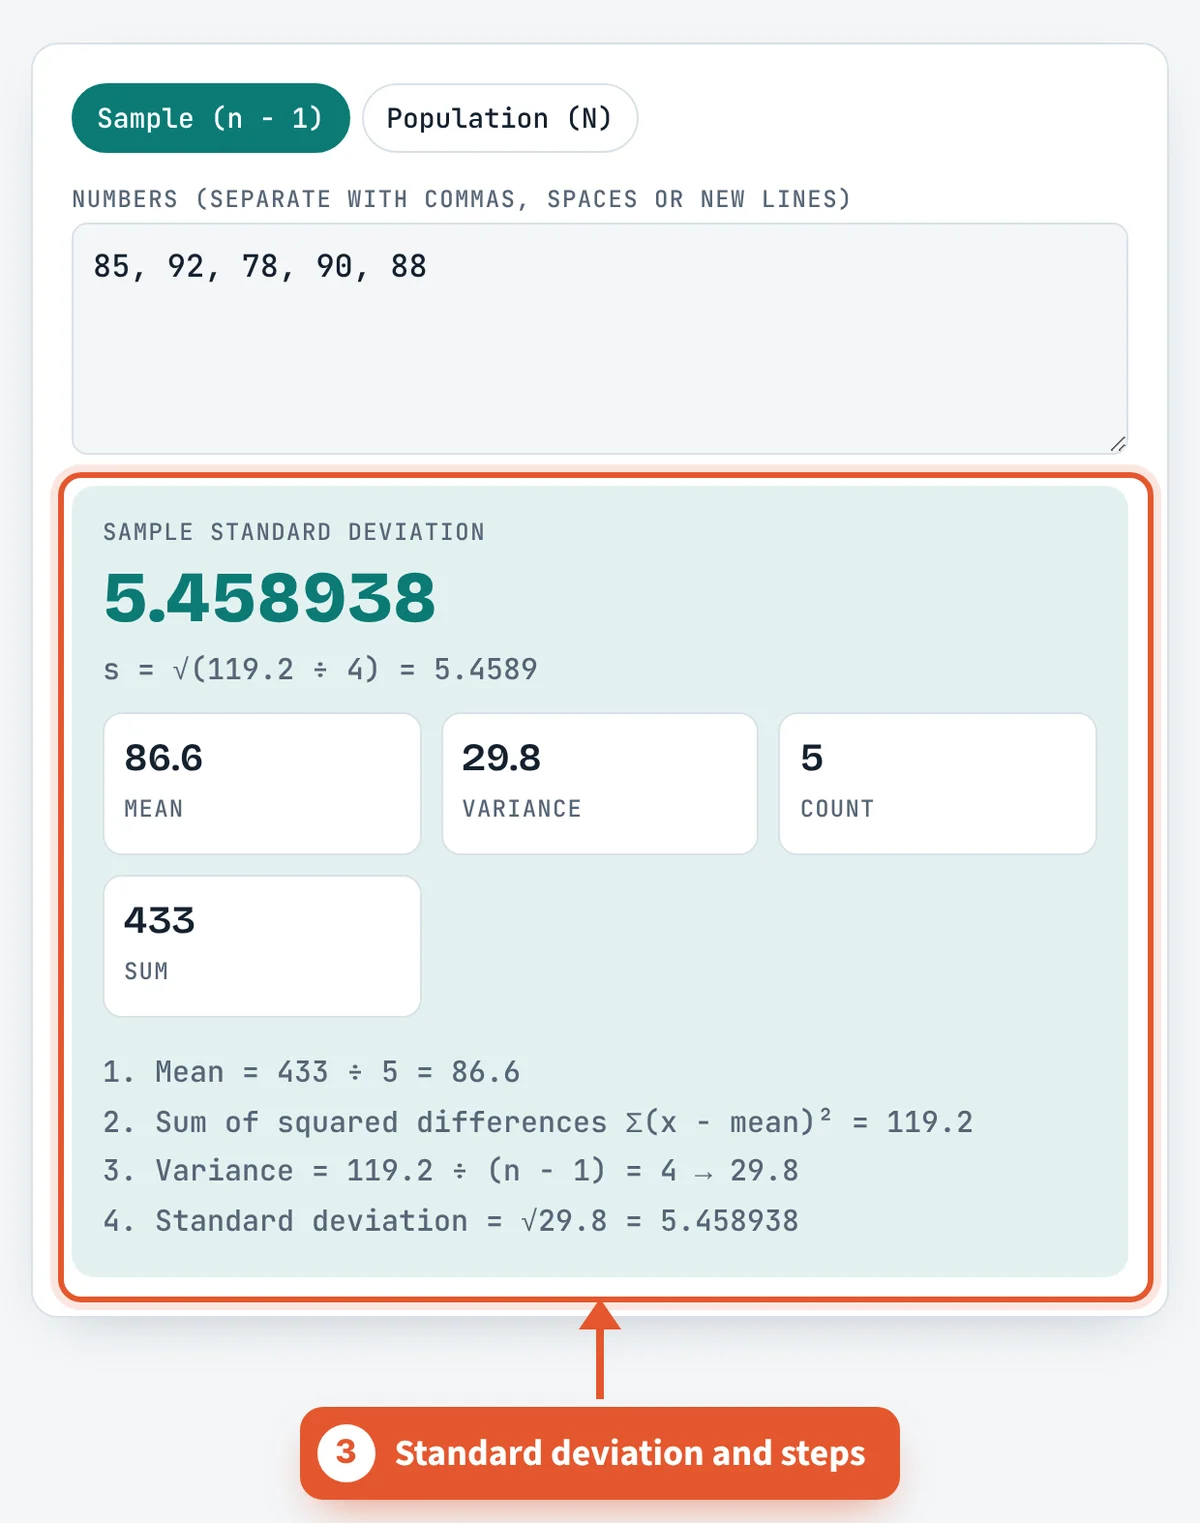
Get the mean first. Then subtract it from each value, square what’s left and add it all up. Divide by n − 1 for a sample (or N if it’s the whole population) and take the square root. Feed 85, 92, 78, 90 and 88 into the standard deviation calculator and you’ll see a mean of 86.6, squared gaps adding to 119.2, and 119.2 ÷ 4 = 29.8. So the sample standard deviation comes out at 5.46.
Standard deviation formulas
Sample: s = √[ Σ(x − x̄)² ÷ (n − 1) ]
Variance? Same math, you just skip the square root at the end. Which is why it shows up in goofy squared units like points² or inches² (what even is a square inch of test score?). Take the root and you’re back in normal units, and that’s why people quote the standard deviation instead.
Sample or population: which one do I pick?
Go population if your list is literally everybody you care about, like final grades for all 24 kids in one class. Go sample when the numbers are standing in for some bigger crowd, say 50 survey replies from a whole city. That n − 1 bit (Bessel’s correction, if your teacher asks) bumps the answer up a touch, since a sample tends to look tidier than the group it came from. Stuck? I’d pick sample. Most stats teachers want that one.
Worked example
| Score (x) | x − mean | (x − mean)² |
|---|---|---|
| 85 | −1.6 | 2.56 |
| 92 | 5.4 | 29.16 |
| 78 | −8.6 | 73.96 |
| 90 | 3.4 | 11.56 |
| 88 | 1.4 | 1.96 |
| Total | 0 | 119.2 |
So for a sample it’s √(119.2 ÷ 4) = √29.8, about 5.46. Treat the five scores as the whole population and it’s √(119.2 ÷ 5) = √23.84, roughly 4.88. Same data, two answers.
The same numbers in Excel and Google Sheets
| What you want | Function | For 85, 92, 78, 90, 88 |
|---|---|---|
| Sample standard deviation | =STDEV.S(A1:A5) | 5.46 |
| Population standard deviation | =STDEV.P(A1:A5) | 4.88 |
| Sample variance | =VAR.S(A1:A5) | 29.8 |
| Population variance | =VAR.P(A1:A5) | 23.84 |
| Standard error of the mean | =STDEV.S(A1:A5)/SQRT(5) | 2.44 |
Older spreadsheets love plain STDEV, which is just the sample one under an old name. Your answer doesn’t match your lab partner’s? Before you redo anything, check who picked sample and who picked population. Nine times out of ten, that’s your culprit.
How to use the Standard Deviation Calculator
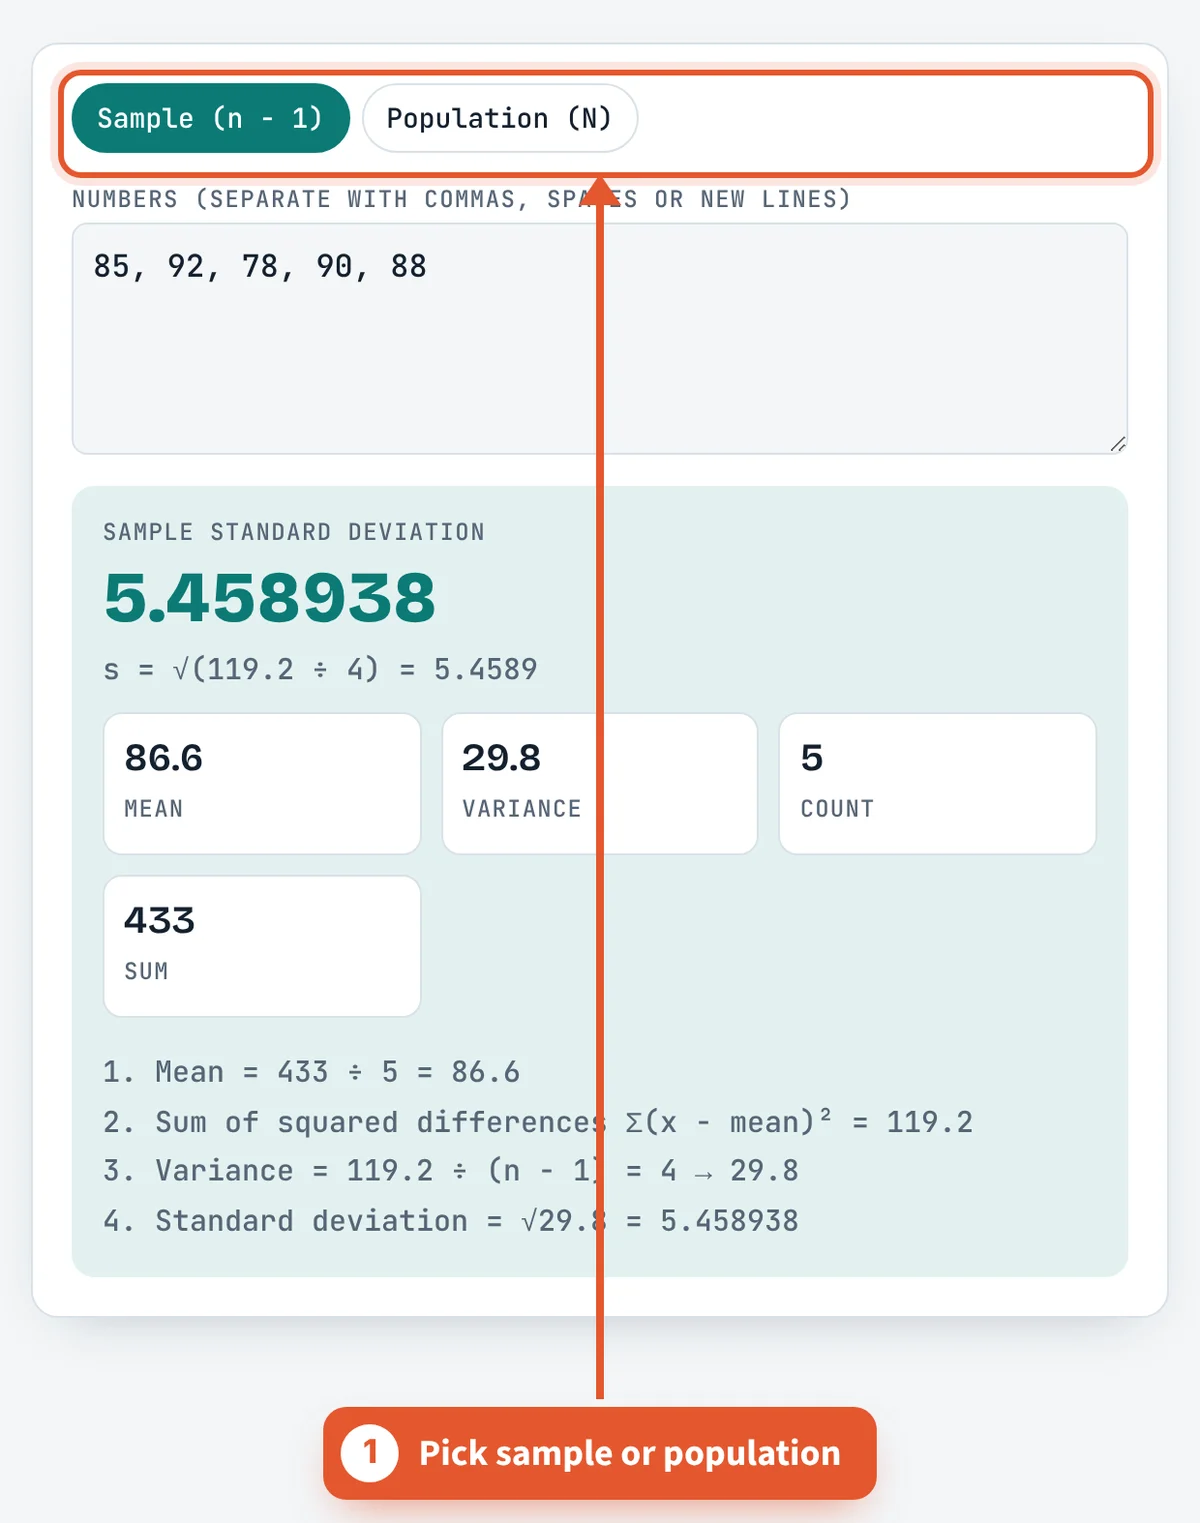
Choose sample or population
Sample if your numbers are a slice of something bigger. Population if they’re the whole thing. Can’t decide? Sample.

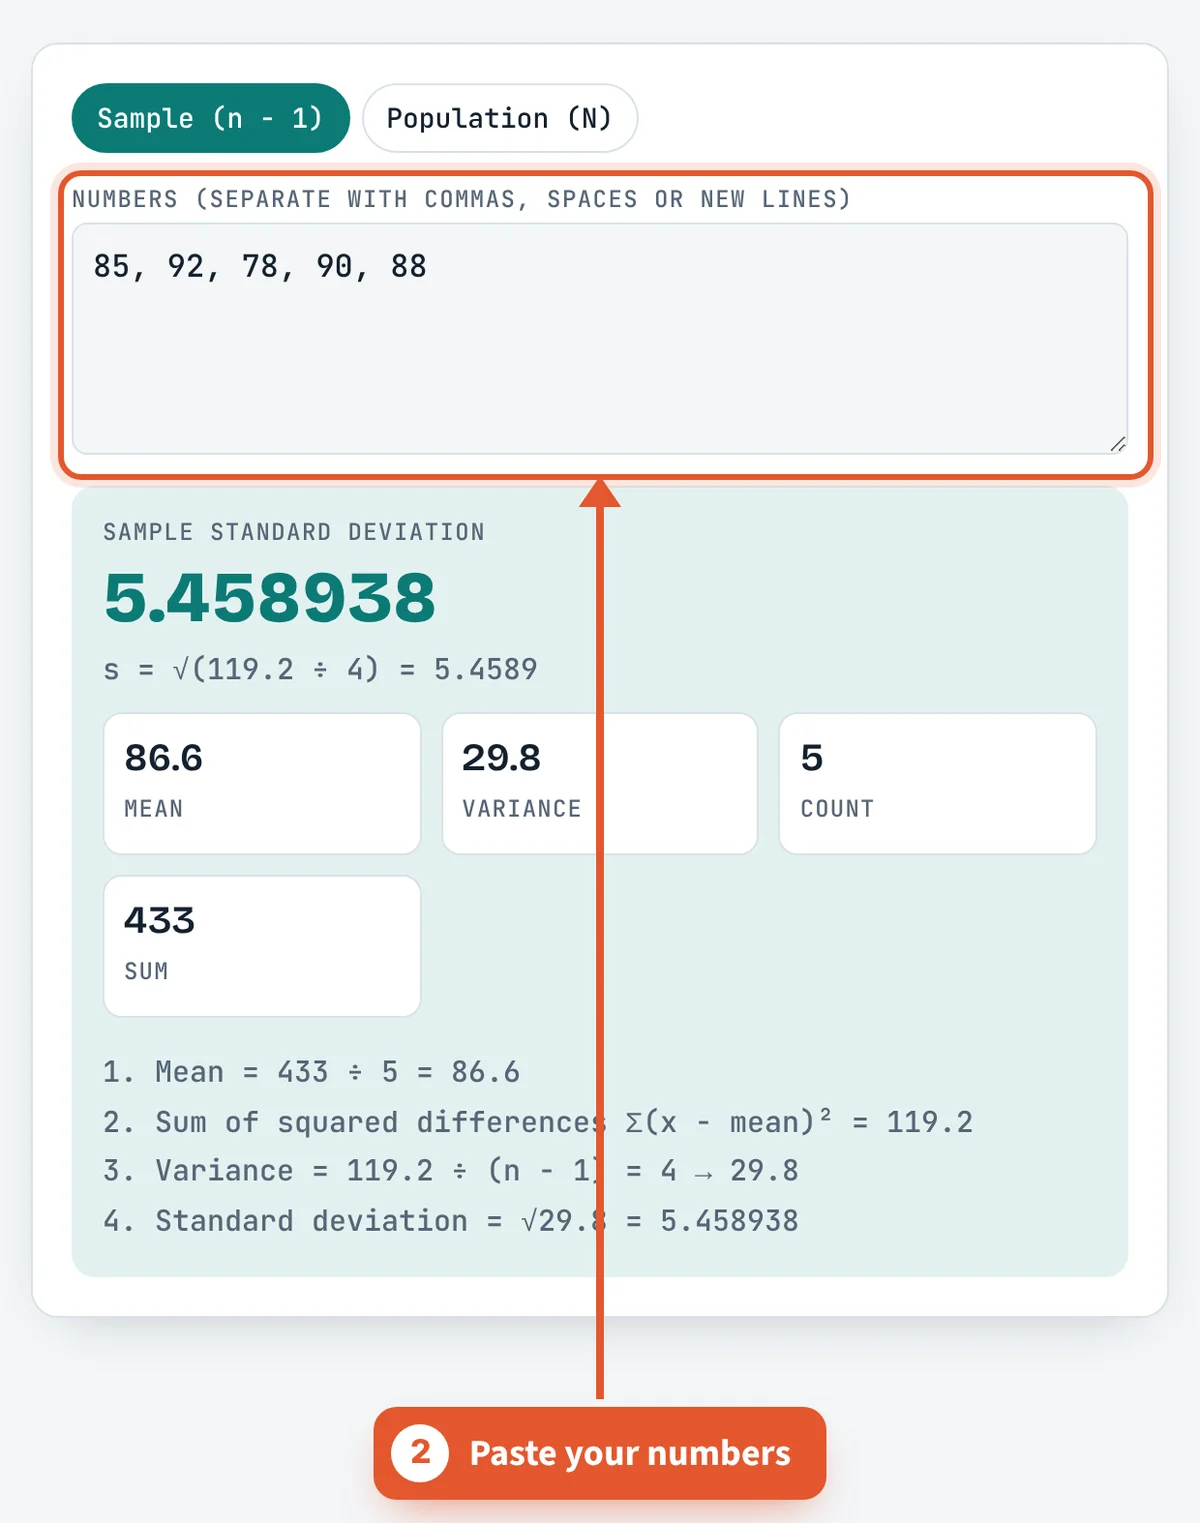
Paste your numbers
Commas, spaces, line breaks, whatever. A column straight out of a spreadsheet works fine, and stray words just get ignored.
Read the result and steps
Standard deviation’s the big number up top. Under it you’ll find variance, mean, count and sum, and then four lines of working you can copy into your homework.
What does standard deviation tell you about a bell curve?
For data that follows a normal distribution, the bell curve studied by Carl Friedrich Gauss, standard deviation maps directly to how much of the data sits near the mean. This is the empirical rule, also called the 68-95-99.7 rule:
- About 68.27% of values fall within 1 standard deviation of the mean.
- About 95.45% fall within 2 standard deviations.
- About 99.73% fall within 3 standard deviations.
So if adult heights in a group average 170 cm with a standard deviation of 7 cm, roughly two thirds of people are between 163 and 177 cm. A value far outside 3 standard deviations is rare enough to deserve a second look.
Not every dataset is bell shaped. Chebyshev’s inequality gives a guarantee for any distribution: at least 75% of values lie within 2 standard deviations, and at least 88.9% within 3. To see exactly how far one value sits from the mean, convert it with the z-score calculator, which divides the distance by the standard deviation.
How is standard deviation different from variance and standard error?
These terms come up together and are easy to mix up.
- Variance is the average squared distance from the mean. It is in squared units (cm² for heights), which makes it awkward to read.
- Standard deviation is the square root of the variance, bringing it back to the original units. Karl Pearson introduced the term in 1894. You can check the last step with the square root calculator.
- Standard error of the mean is the standard deviation divided by the square root of the sample size, s/√n. It describes how precisely a sample mean estimates the true mean, and it shrinks as you collect more data while the standard deviation does not.
- Coefficient of variation is the standard deviation divided by the mean, often shown as a percentage. It lets you compare spread between datasets with different scales.
Start from a reliable mean, which the average calculator gives you, and every one of these follows from it.
Frequently asked questions
What is a good standard deviation?
Honestly, there’s no magic number. A 5-point spread on a 100-point test is pretty tight, but 5 inches across adult heights? Wild. Dividing by the mean (people call that the coefficient of variation) makes comparing easier. For our example scores it’s 5.46 ÷ 86.6, about 6.3%.
Why does the sample formula divide by n − 1?
A sample’s values hug their own mean a bit closer than they’d hug the true mean of the whole group. So dividing by n comes in slightly low. Using n − 1 nudges it back up. That’s really all there is to it.
Should I use STDEV.S or STDEV.P in Excel?
STDEV.S if it’s a sample, STDEV.P if your list is the whole population. Plain old STDEV is just STDEV.S wearing its older name. For 85, 92, 78, 90 and 88 you’d get 5.46 and 4.88.
What's the difference between standard deviation and standard error?
Standard deviation tells you how scattered the data is. Standard error is about how far off the average itself could be, and you get it by dividing the standard deviation by √n. Our example: 5.46 ÷ √5, about 2.44.
Can standard deviation be negative?
Nope. You’re taking a square root of squared stuff, so zero is the floor. And you only hit zero when every single value is identical, like a class where everyone got 80.
What's the difference between variance and standard deviation?
Variance is the average squared distance from the mean. Square-root it and boom, standard deviation, back in the same units as your data.
How does standard deviation relate to the 68-95-99.7 rule?
If your data’s roughly bell-shaped, about 68% of it sits within 1 standard deviation of the mean. Around 95% within 2. And about 99.7% within 3, so anything past that is pretty rare.
Sources and further reading
Related tools
Last reviewed: October 2026