Enter a monthly amount, an expected yearly return and a period to estimate what a systematic investment plan could grow to, with an optional yearly step-up.
| Year | Monthly SIP | Invested | Value |
|---|
Runs in your browser. An estimate at a fixed rate, not investment advice. Real returns vary.
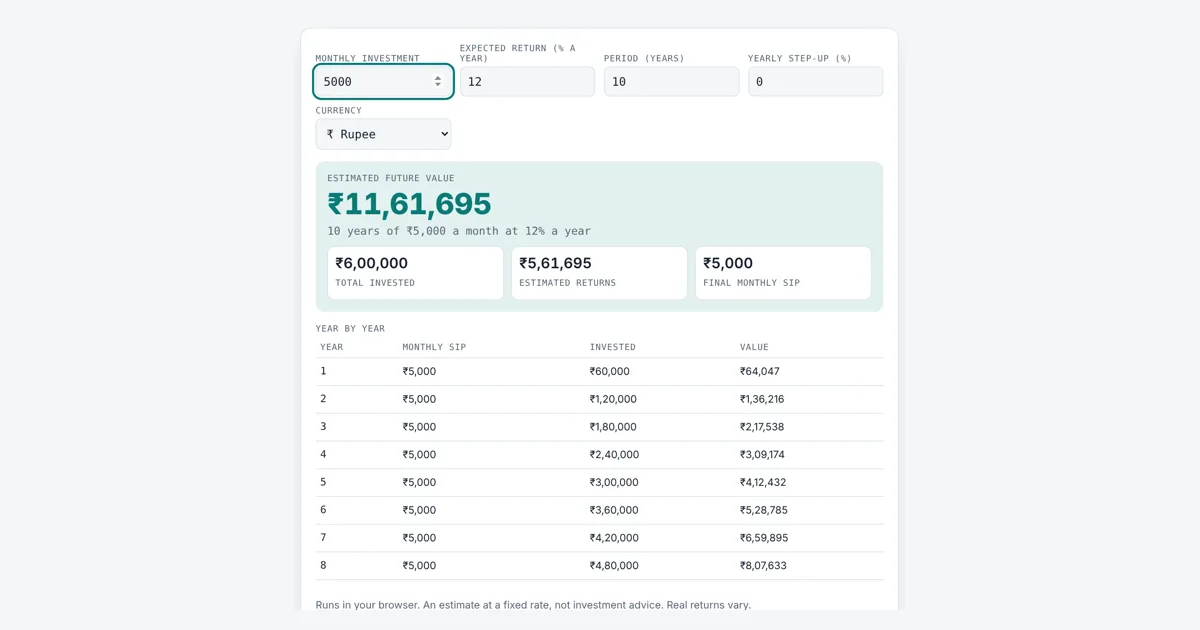
This sip calculator is for anyone planning regular monthly investments in mutual funds, whether in India or elsewhere. It shows an estimated future value, how much you put in, the estimated gain and a yearly table. It assumes a steady rate, so treat the result as an illustration, not a forecast.
How Is SIP Return Calculated?
SIP future value is FV = P × ((1 + i)^n − 1) ÷ i × (1 + i), where P is the monthly amount, i is the yearly return divided by 12 and n is the months. ₹5,000 a month at 12% for 10 years gives about ₹11,61,695, from ₹6,00,000 invested.
What Is a SIP and How Does It Work?
A systematic investment plan (SIP) is a way to put a fixed amount into a mutual fund every month instead of one lump sum. Each instalment buys units at that month’s net asset value, so you buy more units when prices are low and fewer when they are high. This is called rupee cost averaging.
i = expected annual return ÷ 12 ÷ 100 n = years × 12
The last (1 + i) assumes each payment is made at the start of the month, which is how most Indian SIP calculators work, including the one from AMFI, the Association of Mutual Funds in India. Growth on growth is compounding; here it is applied monthly.
How Much Will a ₹5,000 SIP Grow in 10 Years?
At an assumed 12% a year, a ₹5,000 monthly SIP grows to about ₹11,61,695 in 10 years from ₹6,00,000 invested. The table shows how time drives the result, all at 12%.
| Years | Invested | Estimated value | Estimated gain |
|---|---|---|---|
| 1 | ₹60,000 | ₹64,047 | ₹4,047 |
| 3 | ₹1,80,000 | ₹2,17,538 | ₹37,538 |
| 5 | ₹3,00,000 | ₹4,12,432 | ₹1,12,432 |
| 10 | ₹6,00,000 | ₹11,61,695 | ₹5,61,695 |
| 15 | ₹9,00,000 | ₹25,22,880 | ₹16,22,880 |
| 20 | ₹12,00,000 | ₹49,95,740 | ₹37,95,740 |
| 25 | ₹15,00,000 | ₹94,88,175 | ₹79,88,175 |
What Is a Step-Up SIP?
A step-up SIP raises your monthly amount by a fixed percentage once a year, usually to match salary increases. With a 10% yearly step-up, ₹5,000 a month becomes ₹11,790 a month in year 10, and the estimated value at 12% rises to about ₹16,87,163 from ₹9,56,245 invested.
Are SIP Returns Guaranteed?
No, SIP returns are not guaranteed, because mutual fund values move with the market. The 12% used here is only an assumption. SEBI, the Securities and Exchange Board of India, requires funds to warn that past performance may not be sustained. A fixed rate product works differently; the compound interest calculator shows how a lump sum grows at a steady rate, and the savings goal calculator works backward from a target.
Worked Example
Arjun starts a ₹5,000 monthly SIP and assumes 12% a year for 10 years. The calculator shows an estimated value of ₹11,61,695. He invests ₹6,00,000, so the estimated gain is ₹5,61,695. If he adds a 10% yearly step-up, the final monthly SIP is ₹11,790 and the estimated value grows to ₹16,87,163 from ₹9,56,245 invested. At a lower assumed 8%, the plain SIP would reach about ₹9,20,828 instead.
How Do You Use the SIP Calculator?
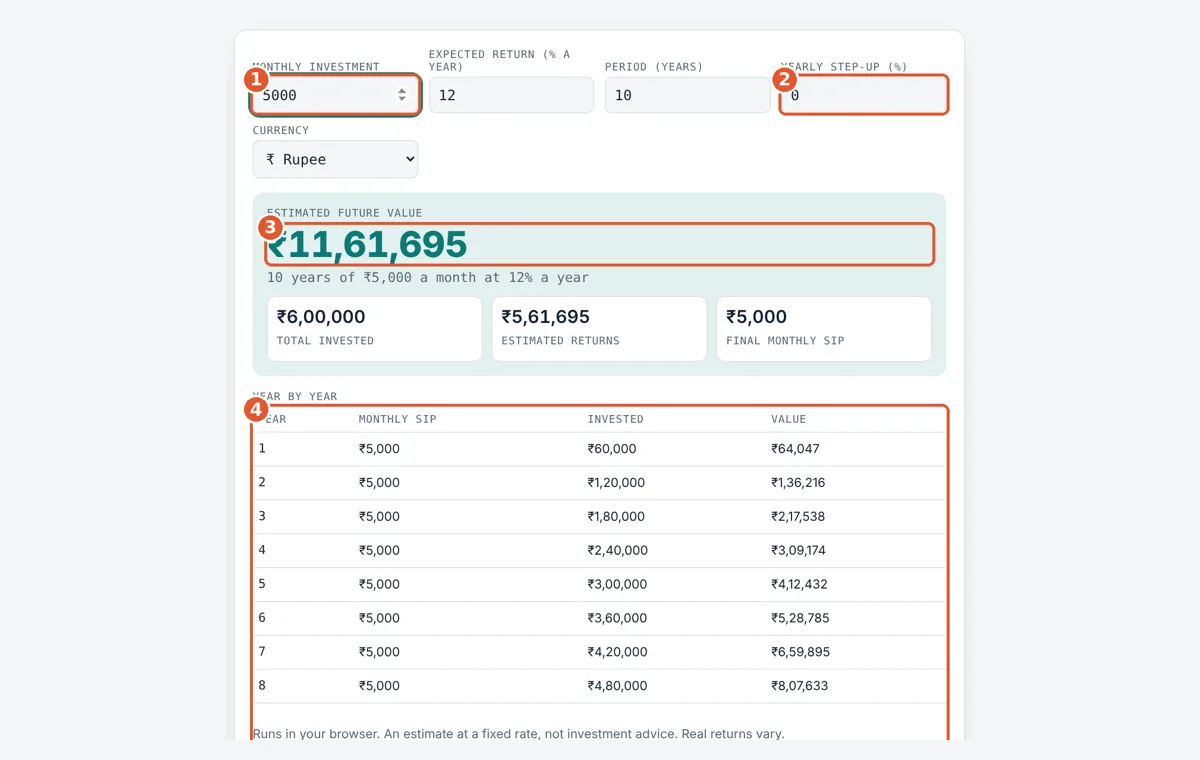
Enter your monthly SIP
Type the amount you plan to invest each month.
Set return, period and step-up
Add an expected yearly return, the number of years and an optional yearly step-up.
Read the future value
The big number is the estimated value, with total invested and estimated returns below.
Check each year
The table lists the monthly SIP, total invested and value at the end of every year.
Frequently Asked Questions
What is the difference between SIP and lump sum investing?
A SIP spreads your money over many months, while a lump sum invests it all at once. In a rising market a lump sum often ends higher, but a SIP lowers the risk of investing everything at a market peak and fits a monthly salary.
Why does my fund statement show a different value?
Real funds earn a different return every month, and calculators assume one steady rate. Exit loads, the expense ratio, taxes and the exact SIP dates also change the result, so your statement will rarely match this estimate exactly.
How much is a ₹10,000 SIP for 15 years at 12%?
At an assumed 12% a year, ₹10,000 a month for 15 years grows to about ₹50,45,760. You invest ₹18,00,000, so the estimated gain is about ₹32,45,760. The real figure depends on actual fund returns.
Does the calculator use start or end of month payments?
It assumes each SIP payment is made at the start of the month, like most Indian calculators. End of month payments earn one month less growth, so ₹5,000 a month at 12% for 10 years would show about ₹11,50,193 instead.
What return should I assume for a SIP?
There is no correct number, since no return is promised. Many people test a few rates, such as 8%, 10% and 12%, to see a range. At those rates ₹5,000 a month for 10 years gives about ₹9.2 lakh, ₹10.3 lakh and ₹11.6 lakh.
Can I stop or change a SIP later?
Most fund houses let you pause, stop, raise or lower a SIP at any time, usually with a short notice period. Stopping does not sell your units; the money already invested stays in the fund and keeps changing in value.
Sources and Further Reading
- AMFI Mutual Funds Sahi Hai: SIP calculator
- SEBI Investor Website: investor education
- AMFI: Association of Mutual Funds in India
Related Tools
Last reviewed: October 2026