Turn any value into a z-score and see its percentile, the area above and below, and the two-tailed p-value on a live normal curve. It also works backwards, from a z-score or percentile to the value.
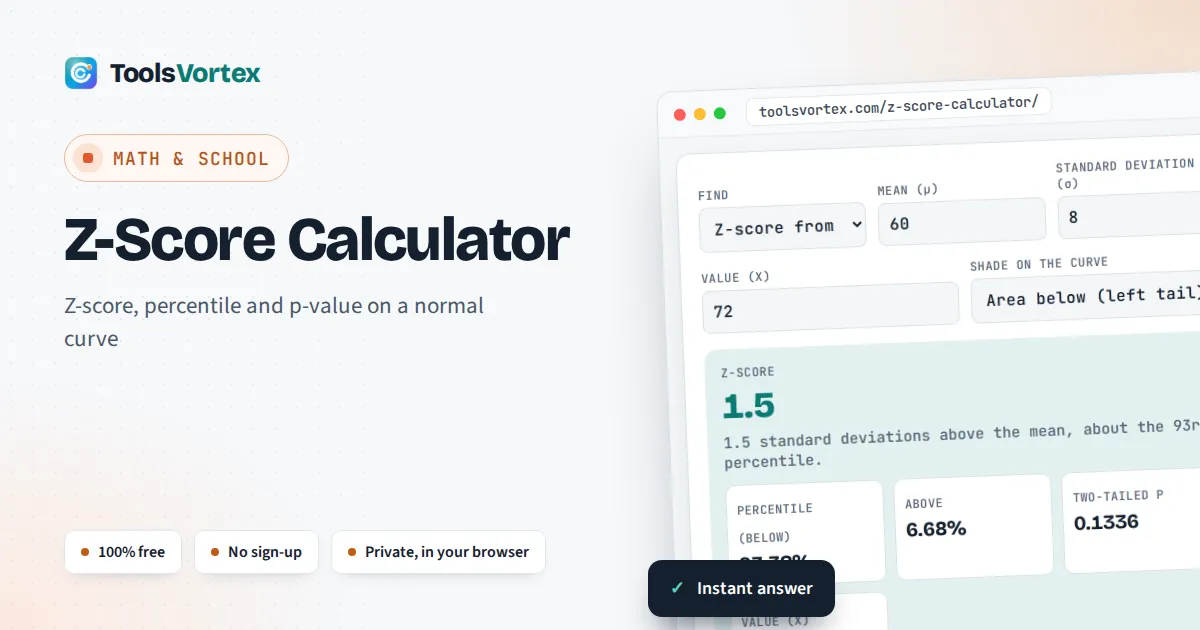
This z-score calculator standardises a value against its mean and standard deviation, for students on statistics, psychology and business courses, researchers checking a result and anyone comparing scores measured on different scales. Enter a value, a mean and a standard deviation to get the z-score, its percentile and the tail areas you would otherwise read from a printed z table, or work backwards from a z-score or percentile to the value.
What is a z-score?
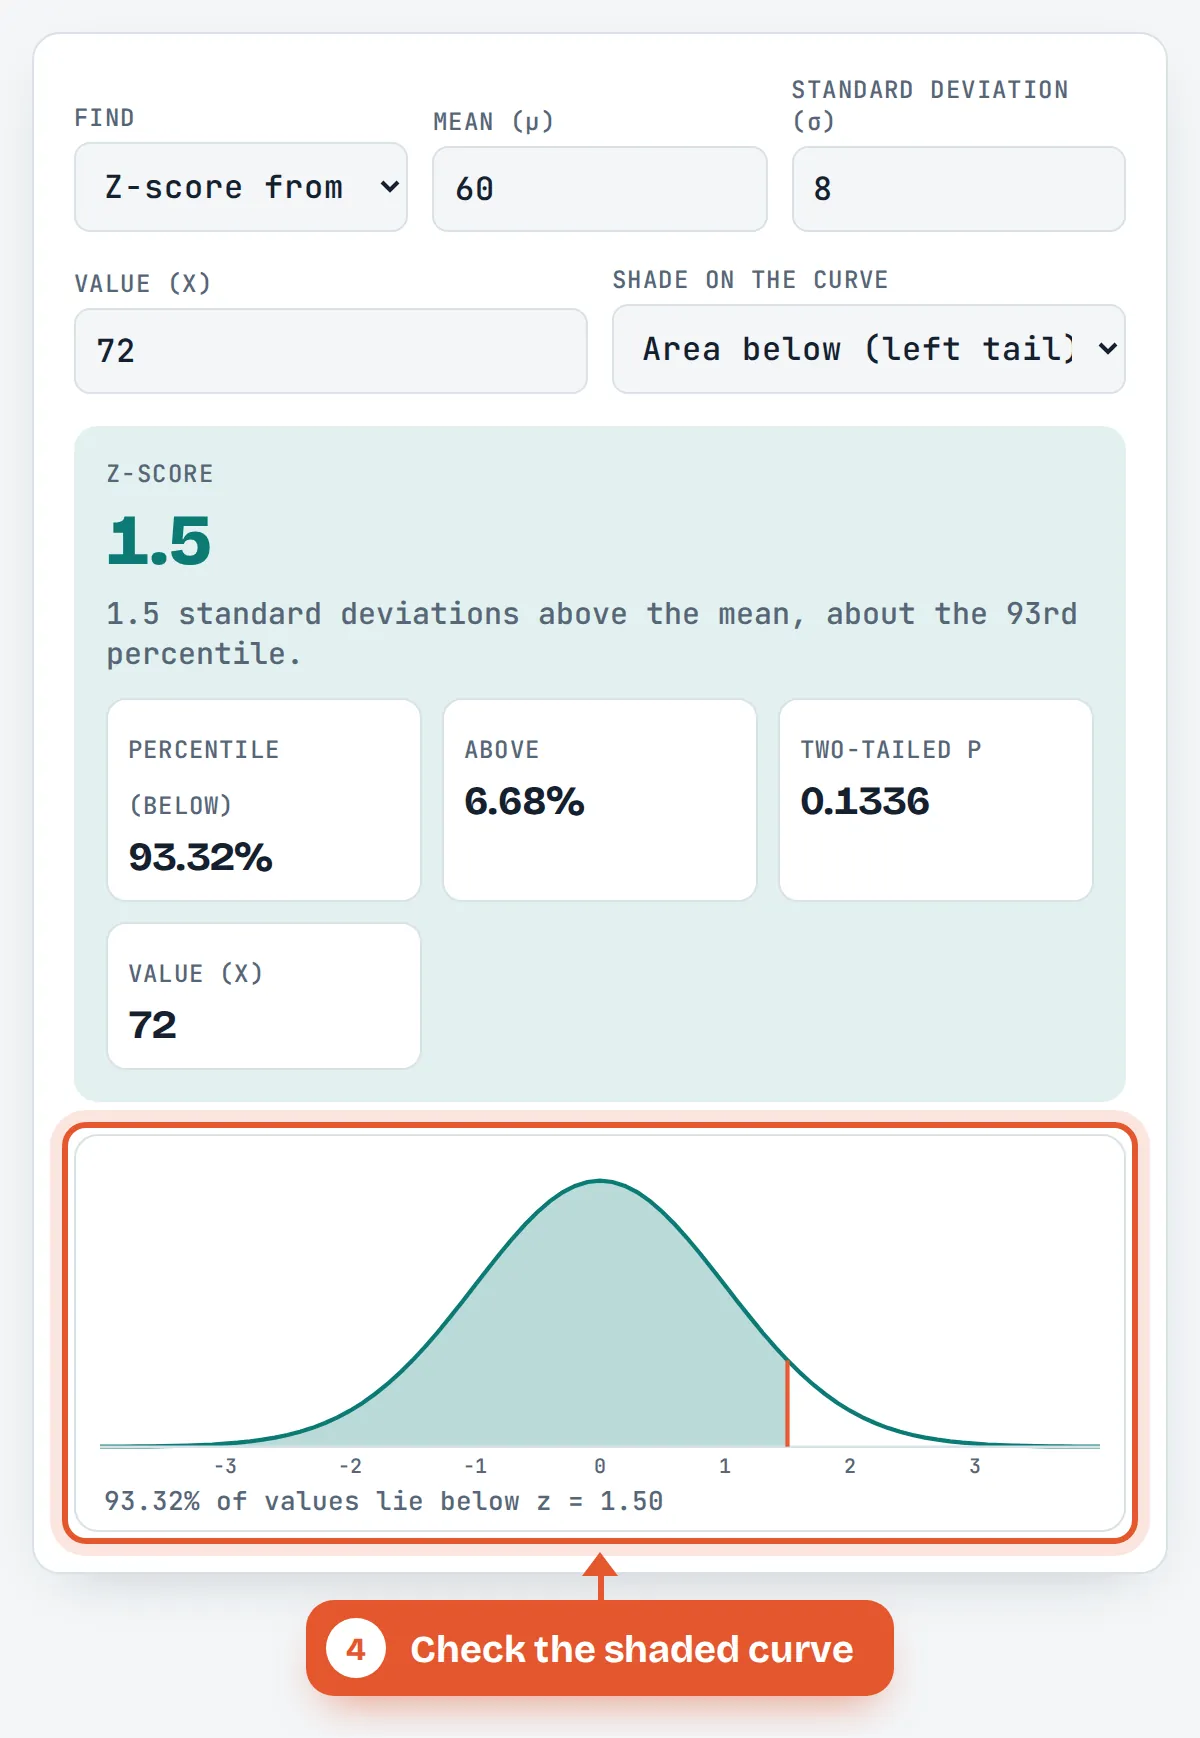
A z-score tells you how many standard deviations a value sits above or below the mean: z = (x − μ) ÷ σ. A positive z is above average, a negative z below. A z-score calculator shows that a score of 72 in a class with mean 60 and standard deviation 8 has z = 1.5, higher than about 93% of a normal distribution.
How do you calculate a z-score?
Subtract the mean from the value, then divide by the standard deviation. The result has no units, which is what lets you compare marks, heights, reaction times or prices on one common scale.
Sample: z = (x − x̄) ÷ s
Back to the value: x = μ + z × σ
Percentile = Φ(z), the area under the standard normal curve to the left of z
If you only have raw data, work out the mean with the average calculator and the spread with the standard deviation calculator first, then bring both numbers here. Use the sample standard deviation s when your data is a sample, and the population σ when you have every value.
Worked example: Tomás compares his maths and French results
Tomás scored 72 in maths, where the year group averaged 60 with a standard deviation of 8, and 80 in French, where the average was 74 with a standard deviation of 5. His maths z-score is (72 − 60) ÷ 8 = 1.5, and his French z-score is (80 − 74) ÷ 5 = 1.2. The French mark is higher, but relative to the group his maths result is stronger: about the 93rd percentile against the 88th, assuming roughly normal marks.
How do you find the percentile from a z-score?
Look up the area to the left of z under the standard normal curve, which is the percentile when the data is roughly normal. A z of 0 is the 50th percentile, 1 is about the 84th and 2 about the 98th. The table below gives the values a printed z table would show, all computed with the same function the calculator uses:
| z | Area below (percentile) | Area above | Two-tailed p |
|---|---|---|---|
| 0 | 0.5000 (50th) | 0.5000 | 1.0000 |
| 0.5 | 0.6915 (69th) | 0.3085 | 0.6171 |
| 1 | 0.8413 (84th) | 0.1587 | 0.3173 |
| 1.282 | 0.9001 (90th) | 0.0999 | 0.1998 |
| 1.5 | 0.9332 (93rd) | 0.0668 | 0.1336 |
| 1.645 | 0.9500 (95th) | 0.0500 | 0.1000 |
| 1.96 | 0.9750 (97.5th) | 0.0250 | 0.0500 |
| 2.326 | 0.9900 (99th) | 0.0100 | 0.0200 |
| 2.576 | 0.9950 (99.5th) | 0.0050 | 0.0100 |
| 3 | 0.9987 (99.9th) | 0.0013 | 0.0027 |
For a negative z, swap the columns: z = −1.5 has 0.0668 below and 0.9332 above. The curve is symmetric, so the two-tailed p stays the same.
What is a good z-score?
There is no single good z-score: it depends on whether high values are good, as with exam marks, or bad, as with error rates. As a rule of thumb, values between −1 and 1 are typical, beyond ±2 are unusual and beyond ±3 are rare. On a normal distribution, 68.27% of values fall within 1 standard deviation of the mean, 95.45% within 2 and 99.73% within 3, which is the 68, 95, 99.7 rule.
That is also why ±3 is a common cut off for flagging outliers in quality control and data cleaning. A z of 3 or more happens by chance only about 0.13% of the time on each side.
What z-score gives a 95% confidence level?
For a two-sided 95% confidence interval or a two-tailed test at the 5% level, the critical z-score is 1.96, because 2.5% of the area lies beyond it in each tail. A one-tailed test at 5% uses 1.645, and 99% two-sided uses 2.576. Choose “Value from a percentile” and enter 97.5 to see 1.96 appear, or set “Both tails” to read the p-value for any z.
When should you not use a z-score?
Z-scores always describe position relative to the mean, but turning them into percentiles assumes the data is roughly normal. Strongly skewed data, such as incomes or house prices, can put far more than 2.5% of values above z = 1.96. Small samples are another case: with fewer than about 30 values and an unknown population standard deviation, statistics courses switch from z to the t distribution, which has fatter tails.
How Do You Use the Z-Score Calculator?
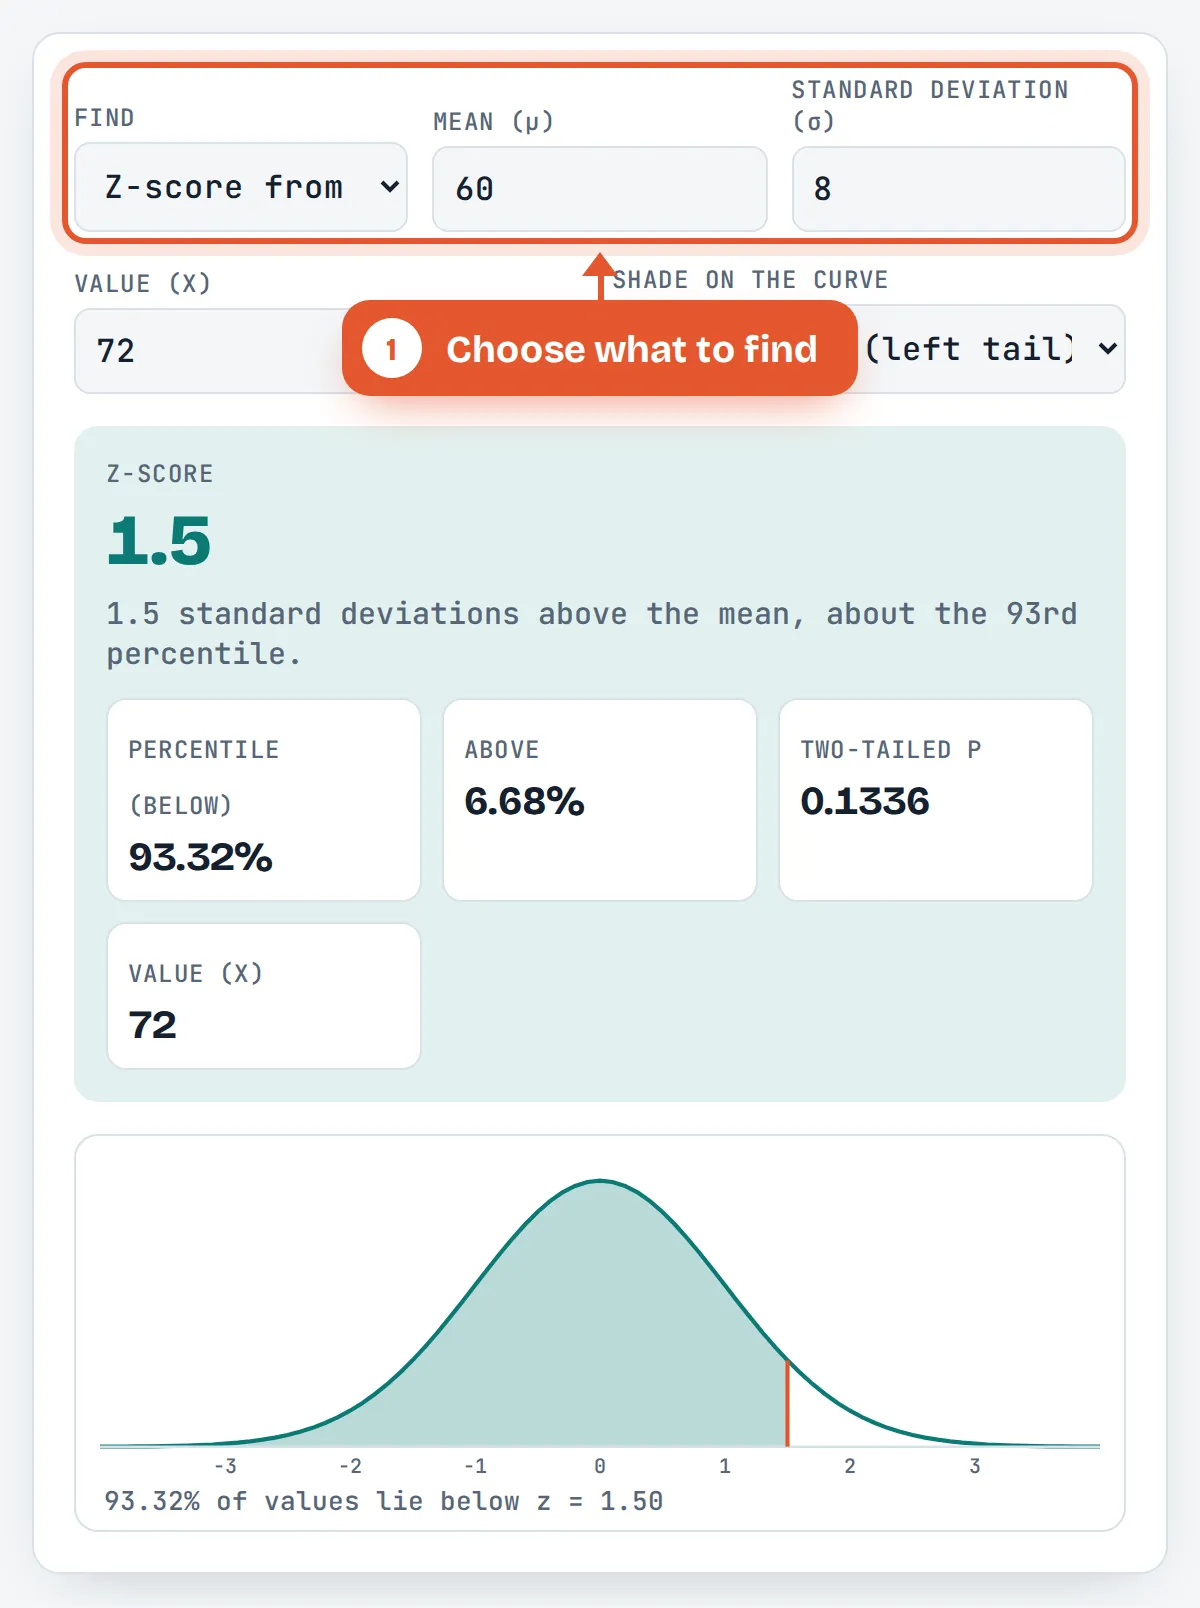
Choose what to find
Pick a z-score from a value, a value from a z-score or percentile, or the probability between two values, and enter the mean and standard deviation.

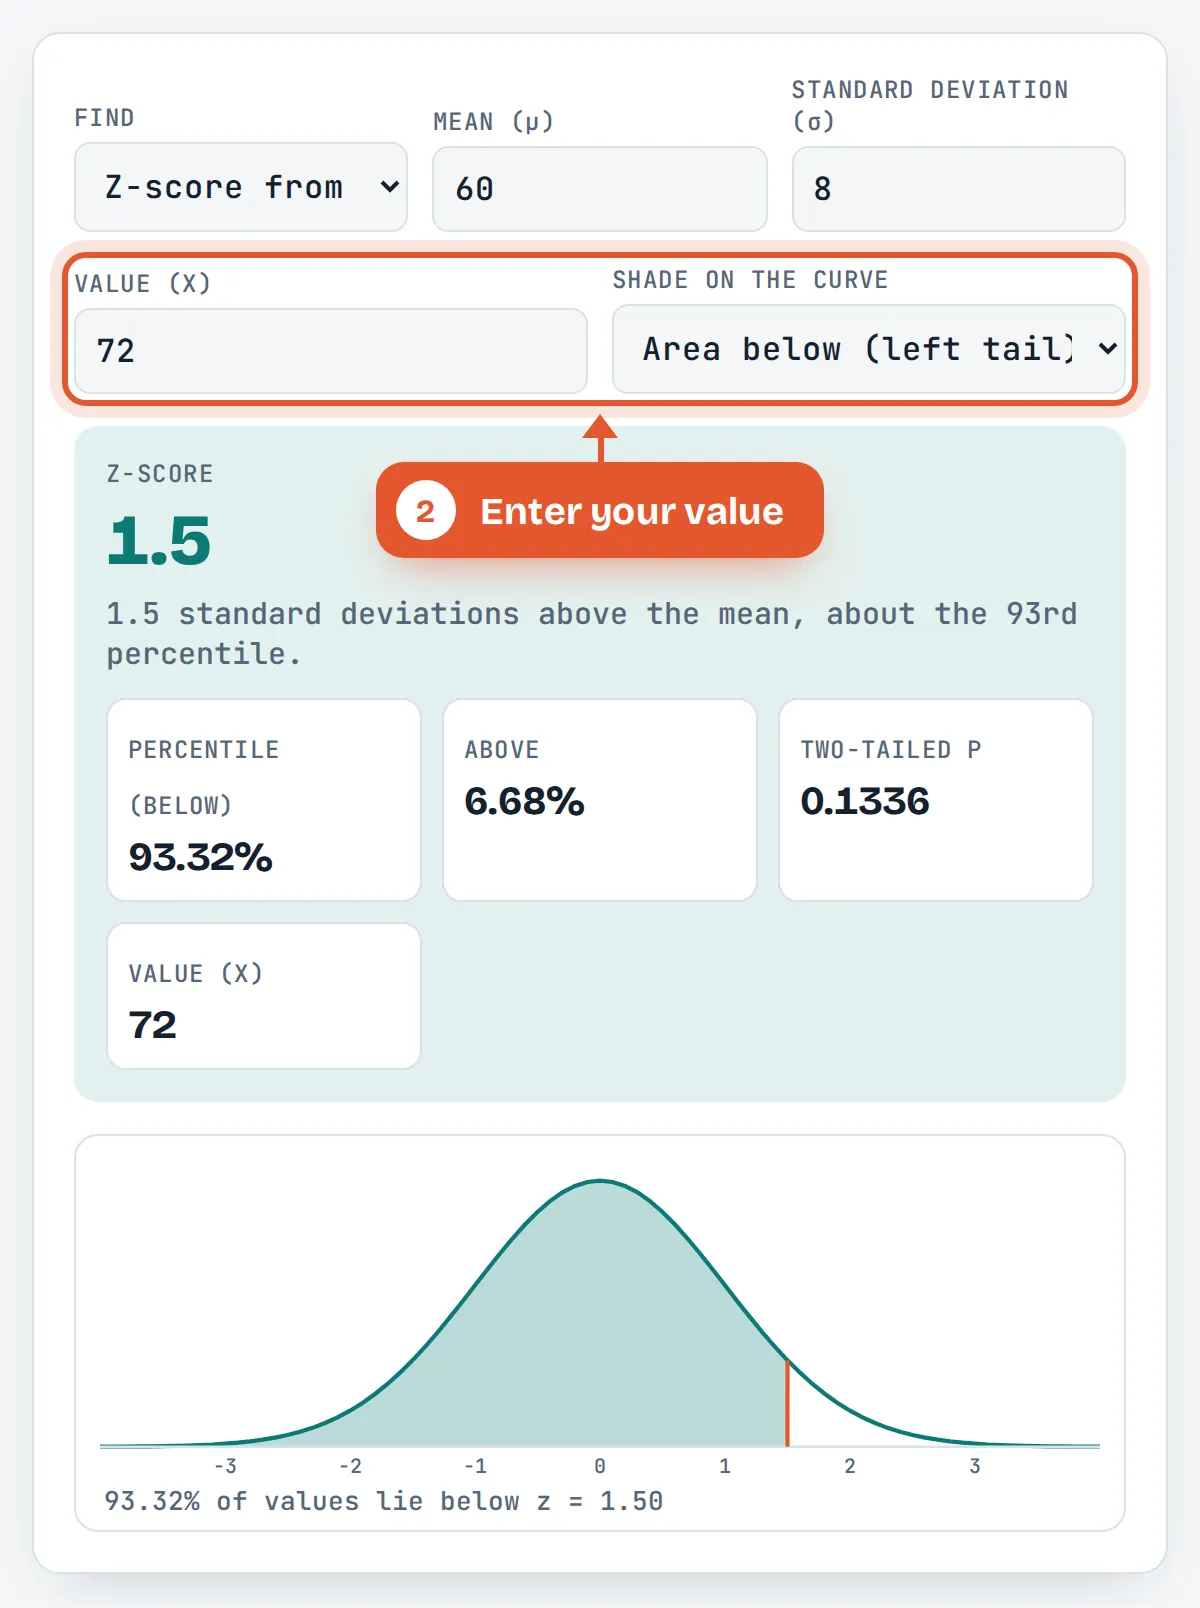
Enter your value
Type the raw score, z-score or percentile. Decimal commas such as 1,5 work too.
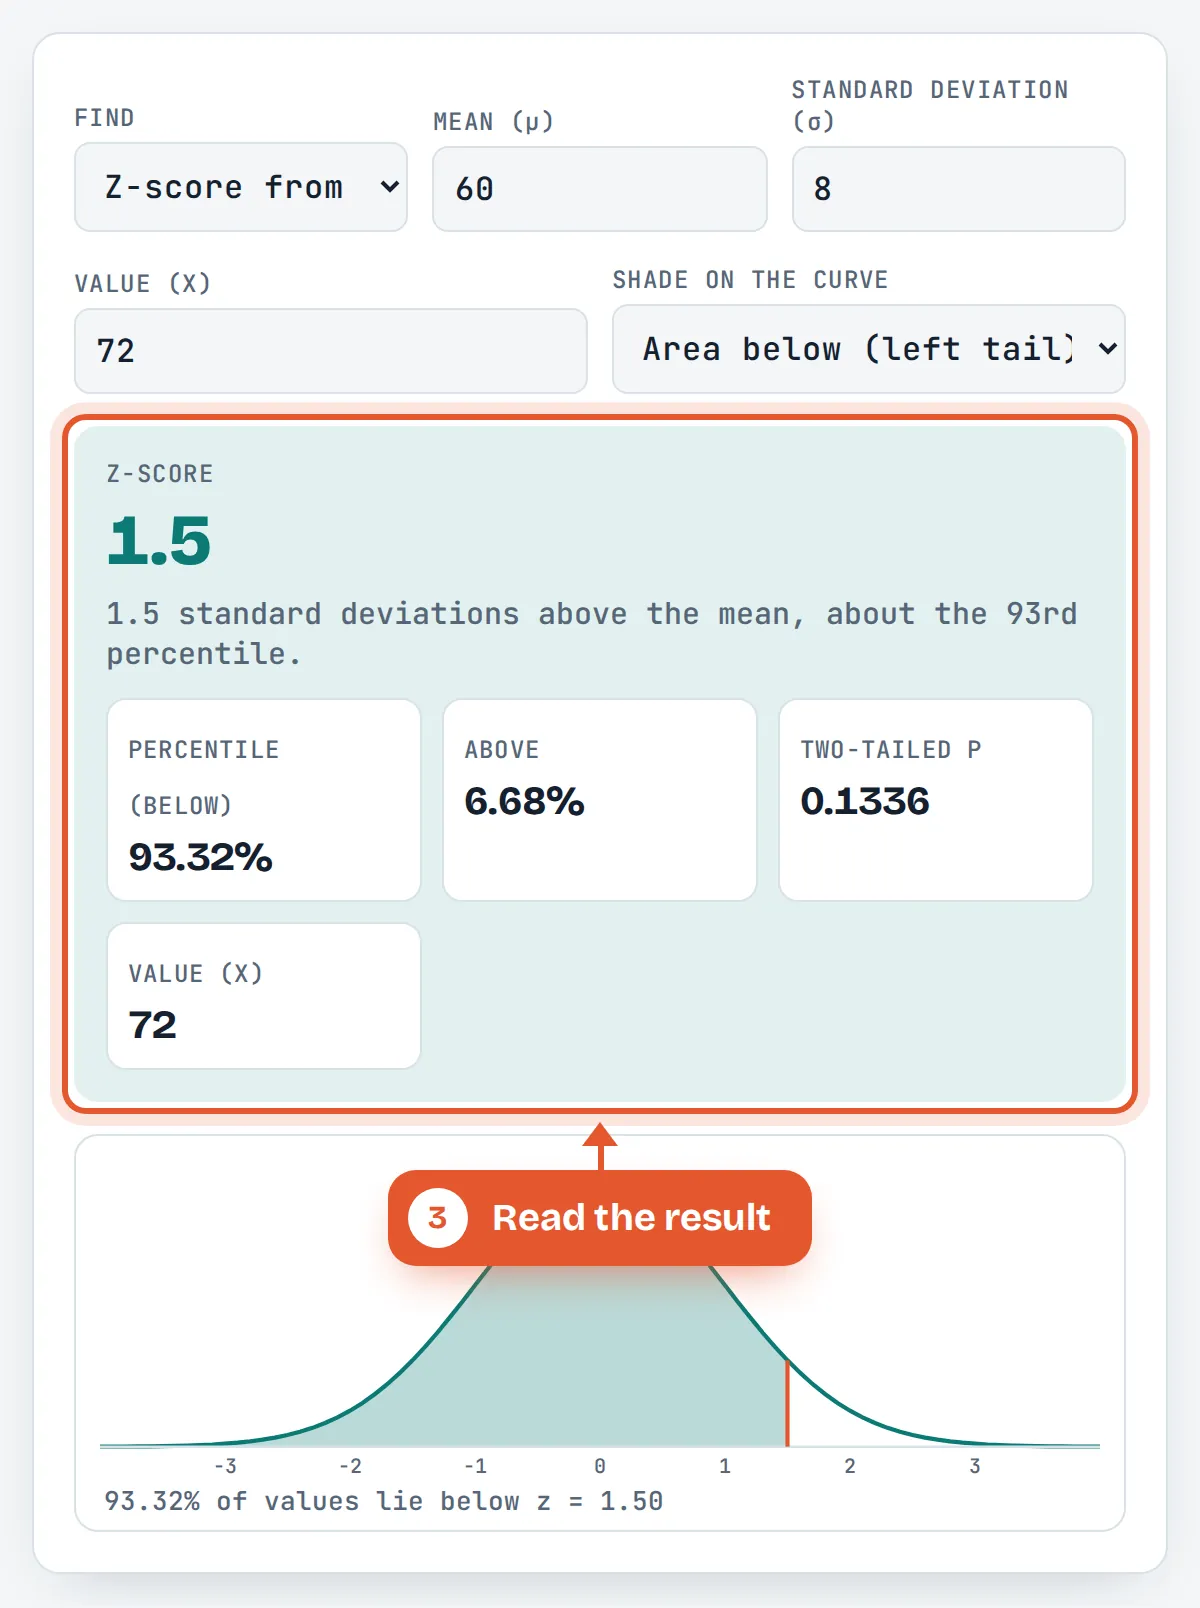
Read the result
The z-score or value appears in large text with the percentile, the area above and the two-tailed p-value.
Check the shaded curve
Switch the shading between left tail, right tail, both tails or the area between the mean and z to see the probability you need.
Frequently Asked Questions
Can a z-score be negative?
Yes. A negative z-score means the value is below the mean. For example, z = −1 means one standard deviation below average, roughly the 16th percentile on a normal distribution. The sign shows the direction, and the size shows how far from the mean the value is.
What does a z-score of 2 mean?
A z-score of 2 means the value is two standard deviations above the mean. On a normal distribution that is about the 98th percentile: 97.72% of values are lower and only 2.28% are higher, so it is unusual but not extreme.
How do you convert a z-score back to a raw score?
Multiply the z-score by the standard deviation and add the mean: x = μ + z × σ. With a mean of 60 and a standard deviation of 8, a z-score of 1.5 gives 60 + 1.5 × 8 = 72. Choose Value from a z-score to do it here.
What is the difference between a z-score and a percentile?
A z-score measures distance from the mean in standard deviations, while a percentile is the share of values below a point. On a normal distribution one converts to the other: z = 1 is about the 84th percentile, and the 95th percentile is about z = 1.645.
Is a z-score the same as a p-value?
No. The z-score is a test statistic, and the p-value is the probability of a result at least that extreme if the null hypothesis is true. A z of 1.96 gives a two-tailed p-value of 0.05, and a z of 2.576 gives 0.01.
Do I use the sample or population standard deviation?
Use the population standard deviation σ when your data covers the whole group, and the sample standard deviation s when it is a sample used to estimate a larger group. With small samples and an unknown σ, a t-score is usually more appropriate than a z-score.
Sources and Further Reading
Related Tools
Last reviewed: October 2026